Sentiment analysis
In this tutorial, you will learn:
The basics of sentiment analysis
How to collect tweets
How to collect financial news headlines
What are the common ways of analysing sentiment
How to measure the accuracy of the sentiment prediction
Intro to sentiment analysis
Collection of tweets
Apply for developer account from Twitter use Tweepy
Code example
import tweepy

# do not share the API key in any public platform (e.g github, public website)
consumer_key = API secret
consumer_secret = API secret
access_token = Access token
access_token_secret = Access secret


# authorisation of consumer key and consumer secret
auth = tweepy.OAuthHandler(consumer_key, consumer_secret)
auth.set_access_token(access_token, access_token_secret)
api = tweepy.API(auth, wait_on_rate_limit=True, wait_on_rate_limit_notify=True)
Access the relevant tweets using the Twitter API
Timeline tweets
id parameter.user_id or screen_name parameters to access the user-specified tweets. For more information regarding the parameters,
please visit the official documentation: https://docs.tweepy.org/en/v3.5.0/api.htmlCode example
# create an empty list
alltweets = []

# extract data from the API
timeline = api.user_timeline(user_id=userid, count=number_of_tweets)
alltweets.extend(timeline)

with open('%s_tweets.csv' % screen_name, 'a') as f:
    writer = csv.writer(f)
    for tweet in alltweets:
         tweet_text = tweet.text.encode("utf-8")
         dates=tweet.created_at
         writer.writerow([dates,tweet_text])
Hashtag/Cashtag tweets
tweepy.Cursor() to access data from hashtag and cashtags.Code example
# extract data from the API
hashtags = tweepy.Cursor(api.search, q=name, lang='en', tweet_mode='extended').items(200)

with open('%s_tweets.csv' % screen_name, 'a') as f:
    writer = csv.writer(f)
    for status in hashtags:
         tweet_text = status.full_text
         dates = str(status.created_at)[:10]
         writer.writerow([dates,tweet_text])
with open('%s_tweets.csv' % screen_name, 'a') as f:
    writer = csv.writer(f)
    for status in hashtags:
        # Add this line
        ** if (datetime.datetime.now() - status.created_at).days <= day_required: **
             tweet_text = status.full_text
             dates = str(status.created_at)[:10]
             writer.writerow([dates,tweet_text])
Stream tweets
Create a class inheriting from StreamListener
# override tweepy.StreamListener
class MyStreamListener(tweepy.StreamListener):
    # add logic to the on_staus method
    def on_status(self, status):
        if (self.tweet_count == self.max_tweets):
            return False
        # collect tweets
        else:
            tweet_text = status.text
            writer = csv.writer(self.output_file)
            writer.writerow([status.created_at,status.extended_tweet['full_text'].encode("utf-8")])
            self.tweet_count += 1

    # add logic to the initialisation function
    def __init__(self, output_file=sys.stdout,input_name=sys.stdout):
        super(MyStreamListener,self).__init__()
        self.max_tweets = 200
        self.tweet_count = 100
        self.input_name = input_name
Create a stream
# add an output_file parameter to store the output tweets
myStreamListener = MyStreamListener(output_file=f, input_name=firm)
myStream = tweepy.Stream(auth=api.auth, tweet_mode='extended', listener=myStreamListener, languages=["en"])
Start a stream
myStream.filter(track=target_firm)
Collect financial headlines
US news headlines
Access the website of each ticker through the
urllib.requestmodule
allnews = []
finviz_url = 'https://finviz.com/quote.ashx?t='
url = finviz_url + ticker
req = Request(url=url, headers={'user-agent': 'my-app/0.0.1'})
Get the HTML document using Beautiful Soup
html = BeautifulSoup(resp, features="lxml")
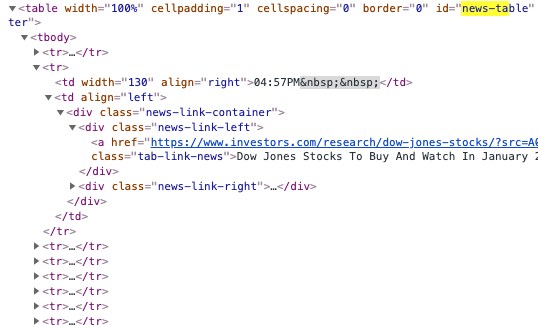
Get the information of <div> id=’news-table’ in the website
news_table = html.find(id='news-table')
news_tables[ticker] = news_table
Find all the news under the <tr> tag in the news-table
for info in df.findAll('tr'):
    text = info.a.get_text()
    date_scrape = info.td.text.split()
    if (len(date_scrape) == 1):
        time = date_scrape[0]
    else:
        date = date_scrape[0]
        time = date_scrape[1]
        news_time_st r= date + " " + time
Convert the date format to ‘YYYY-MM-dd’
date_time_obj = datetime.datetime.strptime(news_time_str, '%b-%d-%y %I:%M%p')
date_time=date_time_obj.strftime('%Y-%m-%d')
Append all the news together
allnews.append([date_time,text])
HK news headlines
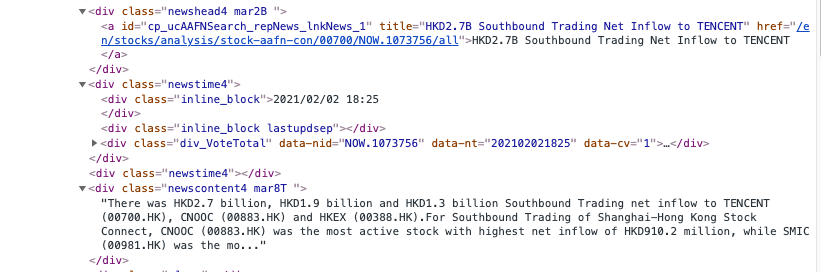
date' attribute is stored within the <div class ='inline_block> under the
<div class='newstime 4'>, while the news headlines are stored within the <div class='newscontent4 mar8T'>.Access the website of each ticker through
urllib.requestmodule
prefix_url = 'http://www.aastocks.com/en/stocks/analysis/stock-aafn/'
postfix_url = '/0/all/1'
url = prefix_url + fill_ticker + postfix_url
req = Request(url=url, headers={'user-agent': 'my-app/0.0.1'})
resp = urlopen(req)
Get the HTML document using Beautiful Soup
html = BeautifulSoup(resp, features="lxml")

# get the html code containing the dates and news
dates = html.findAll("div", {"class": "inline_block"})
news = html.findAll("div", {"class": "newshead4"})
Find all the news and corresponding dates from the html code from step 2
# track the index in the news list
idx = 0

with open('%s_tweets.csv' % screen_name, 'a') as f:
    writer = csv.writer(f)
    for i in dates:
        # as the dates are in yyyy/mm/dd format
        if "/" in str(i.get_text()):
            date = str(i.get_text())
            # the front-end code is not standardised and sometimes contains 'Release Time' string
            if "Release Time" in date:
                date = date[13:23]
        else:
            date = str(date[:10])
            text = news[idx].get_text()
            date_time_obj = datetime.datetime.strptime(date, '%Y/%m/%d')

            # standardise the date format as 'YYYY-mm-dd'
            date_time = date_time_obj.strftime('%Y-%m-%d')

            # set the number of days you want to collect
            if (datetime.datetime.now()-date_time_obj).days <= day_required:
                writer.writerow([date_time,text])
                idx += 1
VADER sentiment prediction
Positive sentiment (= 2): compound score > 0.01
Neutral sentiment (= 1): −0.01 ≥ compound score ≤ 0.01
Negative sentiment (= 0): compound score < −0.01
Import these libraries
import pandas as pd
import nltk
from nltk.sentiment.vader import SentimentIntensityAnalyzer
from nltk.corpus import twitter_samples
VADER’s
SentimentIntensityAnalyzer()takes in a string and returns a dictionary of scores in each of four categories:
negative
neutral
positive
compound (computed by normalising the scores above, ranging from -1 to 1)
Let us analyse the data that we have collected through the sentimental analyser.
# pass in the path where you stored the csv file containing the data
def read_tweets_us_path(path):
    # could change to your own path
    path = os.path.join(dir_name,'train-data/'+path)
    # read in data as pandas dataframe
    df = pd.read_csv(path)
    cs = []

    for row in range(len(df)):
        cs.append(analyzer.polarity_scores(df['tweets'].iloc[row])['compound'])

    # create a new column for the calculated results
    df['compound_vader_score'] = cs
    print(df)

    return df
Label the sentiment for each tweet
Parameters:
grouped_data: consolidated data with features including (dates, tweets, compound_vader_score)
file_name: the output name after the label function
perc_change: the threshold value for labelling the sentiment
Code example
def find_tweets_pred_label(grouped_data,file_name,perc_change):
    print('find_pred_label')
    tweets = grouped_data['tweets']

# group the tweets within the csv using ['dates','ticker'] index,
grouped_data = grouped_data.groupby(['dates','ticker'])['compound_vader_score'].mean().reset_index()

final_label = []

for i in range(len(grouped_data)):
    if grouped_data['compound_vader_score'].iloc[i] > perc_change:
        final_label.append(2)
    elif grouped_data['compound_vader_score'].iloc[i] < -perc_change:
        final_label.append(0)
    elif ((grouped_data['compound_vader_score'].iloc[i] >= -perc_change) and (grouped_data['compound_vader_score'].iloc[i] <= perc_change)):
        final_label.append(1)

# add the column of vader_label
grouped_data['vader_label'] = final_label
grouped_data['tweets'] = tweets

grouped_data.to_csv(file_name)
actual label (= 2): price movement ≥ 0.01
actual label (= 1): −0.01 ≥ price movement ≤ 0.01
actual label (= 0): price movement ≤ −0.01
file_name: consolidated data with features including (dates,tweets,compound_vader_score)label_data: the label data contains the actual label from yahoo finance
Code example
def merge_actual_label (file_name,label_data):

    vader_data = pd.read_csv(file_name)
    vader_data.set_index(keys=["dates","ticker"], inplace=True)

    label_data = pd.read_csv(label_data)
    label_data.set_index(keys=["dates","ticker"], inplace=True)

    # merge the actual label and the predicted label into a single pandas data frame
    merge = pd.merge(vader_data,label_data, how='inner', left_index=True, right_index=True)
    merge.drop(columns=['Unnamed: 0_y'], axis=1)

    return merge
Parameters:
df: the final merged pandas dataframename: the output csv file containing all the merged information with dates, tweets, vader label and actual label
Code illustration
from sklearn.metrics import confusion_matrix
import matplotlib.pyplot as plt

def validation(df,name):
    pred_label = list(df['vader_label'])
    actual_label = list(df['label'])
    labels = [0,1,2]

    cm = confusion_matrix(actual_label, pred_label,labels)
    labels = ['True Neg','False Pos','False Neg','True Pos']
    categories = ['Negative','Neutral', 'Positive']

    make_confusion_matrix(cm, group_names=labels, categories=categories)

    df.to_csv(name)
Attention